
Interpretable Topic Analysis

Interpretable Topic Analysis

Mincheol Kim*

* Swiss Institute of Artificial Intelligence, Chaltenbodenstrasse 26, 8834 Schindellegi, Schwyz, Switzerland

Abstract

User-generated data, often characterized by its brevity, informality, and noise, poses a significant challenge for conventional natural language processing techniques, including topic modeling. User-generated data encompasses informal chat conversations, Twitter posts laden with abbreviations and hashtags, and an excessive use of profanity and colloquialisms. Moreover, it often contains "noise" in the form of URLs, emojis, and other forms of pseudo-text that hinder traditional natural language processing techniques.

This study sets out to find a principled approach to objectively identifying and presenting improved topics in short, messy texts. Topics, the thematic underpinnings of textual content, are often "hidden" within the vast sea of user-generated data and remain "undiscovered" by statistical methods, such as topic modeling.

We explore innovative methods, building upon existing work, to unveil latent topics in user-generated content. The techniques under examination include Latent Dirichlet Allocation (LDA), Reconstructed LDA (RO-LDA), Gaussian Mixture Models (GMM) for distributed word representations, and Neural Probabilistic Topic Modeling (NPTM).

Our findings suggest that NPTM exhibits a notable capability to extract coherent topics from short and noisy textual data, surpassing the performance of LDA and RO-LDA. Conversely, GMM struggled to yield meaningful results. It is important to note that the results for NPTM are less conclusive due to its extended computational runtime, limiting the sample size for rigorous statistical testing.

This study addresses the task of objectively extracting meaningful topics from such data through a comparative analysis of novel approaches.

Also, this research contributes to the ongoing efforts to enhance topic modeling methodologies for challenging user-generated content, shedding light on promising directions for future investigations.
This study presents a comprehensive methodology employing Graphical Neural Topic Models (GNTM) for textual data analysis. "Group information" here refers to topic proportions (theta). We applied a Non-Linear Factor Analysis (FA) approach to extract this intricate structure from text data, similar to traditional FA methods for numerical data.

Our research showcases GNTM's effectiveness in uncovering hidden patterns within large text corpora, with attention to noise mitigation and computational efficiency. Optimizing topic numbers via AIC and agglomerative clustering reveals insights within reduced topic sub-networks.
Future research aims to bolster GNTM's noise handling and explore cross-domain applications, advancing textual data analysis.

1. Introduction

Over the past few years, the volume of news information on the Internet has seen exponential growth. With news consumption diversifying across various platforms beyond traditional media, topic modeling has emerged as a vital methodology for analyzing this ever-expanding pool of textual data. This introduction provides an overview of the field and the seminal work of foundations.

1.1 Seminal work: topic modeling research

One of the pioneering papers in news data analysis using topic modeling is "Latent Dirichlet Allocation" ,that is, LDA technique, which revolutionized the extraction and analysis of topics from textual data.

The need for effective topic modeling in the context of the rapidly growing user-generated data landscape has been emphasized. The challenges posed by short, informal, and noisy text data, including news articles, are highlighted.

There are numerous advantages of employing topic modeling techniques for news data analysis, including:

  • Topic derivation for understanding frequent news coverage.
  • Trend analysis for tracking news trends over time.
  • Identifying correlations between news topics.
  • Automated information extraction and categorization.
  • Deriving valuable insights for decision-making.

Recent advancements in the fusion of neural networks with traditional topic modeling techniques have propelled the field forward. Papers such as "Neural Topic Modeling with Continuous Neighbors" have introduced innovative approaches that warrant exploration. By harnessing deep learning and neural networks, these approaches aim to enhance the accuracy and interpretability of topic modeling.

Despite the growing importance of topic modeling, existing topic modeling methods do not sufficiently consider the context between words, which can lead to difficult interpretation or inaccurate results. This limits the usability of topic modeling. The continuous expansion of text documents, especially news data, underscores the urgency of exploring its potential across various fields. Public institutions and enterprises are actively seeking innovative services based on their data.

To address the limitations of traditional topic modeling methods, this paper proposes the Graphical Neural Topic Model (GNTM). GNTM integrates graph-based neural networks to account for word dependencies and context, leading to more interpretable and accurate topics.

1.2 Research objectives

This study aims to achieve the following objectives:

  • Present a novel methodology for topic extraction from textual data using GNTM.
  • Explore the potential applications of GNTM in information retrieval, text summarization, and document classification.
  • Propose a topic clustering technique based on GNTM for grouping related documents.

In short, the primary objectives are to present GNTM's capabilities, explore its applications in information retrieval, text summarization, document classification, and propose a topic clustering technique.

The subsequent sections of this thesis delve deeper into the methodology of GNTM, experimental results, and the potential applications in various domains. By the conclusion of this research, these contributions are expected to provide valuable insights into the efficient management and interpretation of voluminous document data in an ever-evolving information landscape.

2. Problem definition
2.1 Existing industry-specific keywords analysis

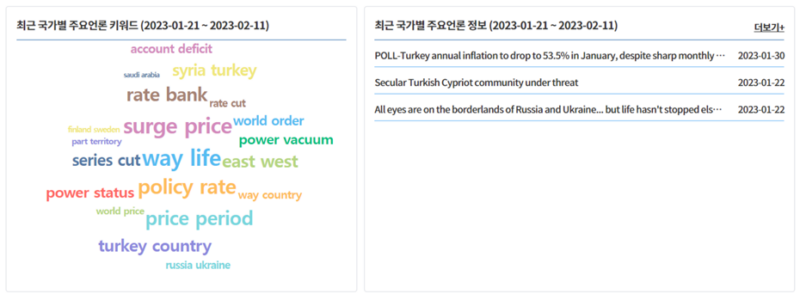
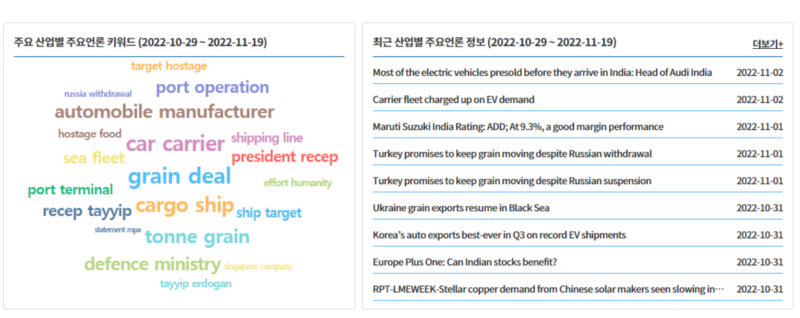
South Korea boasts one of the world's leading economies, yet its reliance on foreign demand surpasses that of domestic demand, rendering it intricately interconnected with global economic conditions[3]. This structural dependency implies that even a minor downturn in foreign economies could trigger a recession within Korea if the demand for imports from developed nations declines. In response, public organizations have been established to facilitate Korean company exports worldwide.

However, the efficacy of these services remains questionable, with South Korea's exports showing a persistent downward trajectory and a trade deficit anticipated for 2022. The central issue lies in the inefficient handling of global textual data, impeding interpretation and practical application.

Figure 1a*. Country-specific keywords
Figure 1b*. Industry-specific keywords: *Data service provided by public organization

Han, G.J(2022) scrutinized the additional features and services available to paid members through the utilization of big data and AI capabilities based on domestic logistics data[5]: Trade and Investment Big Data (KOTRA), Korea Trade Statistics Information Portal (KTSI), GoBiz Korea (SME Venture Corporation), and K-STAT (Korea Trade Association).

Regrettably, these services predominantly offer basic frequency counts, falling short of delivering valuable insights. Furthermore, they are confined to providing internal and external statistics, rendering their output less practical. While BERT and GPT have emerged as potential solutions, these models excel in generating coherent sentences rather than identifying representative topics based on company and market data and quantifying the distribution of these topics.

2.2 Proposed model for textual data handling

To address the challenge of processing extensive textual data, we introduce a model with distinct characteristics:

  1. Extraction of information from data collected within defined timeframes.
  2. A model structure producing interpretable outcomes with traceable computational pathways.
  3. Recommendations based on the extracted information.

Previous research mainly relied on basic statistics to understand text data. However, these methods have limitations, such as difficulty in determining important topics and handling large text sets, making it hard for businesses to make decisions.

Our research introduces a method for the precise extraction and interpretation of textual data meaning via a natural language processing model. Beyond topic extraction, the model will uncover interrelationships between topics, enhance text data handling efficiency, and furnish detailed topic-related insights. This innovative approach promises to more accurately capture the essence of textual data, empowering companies to formulate superior strategies and make informed decisions.

2.3 Scope and contribution

This study concentrates on the extraction and clustering of topics from textual data derived from numerous companies' news data sources.

However, its scope is confined to outlining the methodology for collecting news data from individual firms, extracting topic proportions, and clustering based on these proportions. We explicitly state the study's limitations concerning the specific topics under investigation to bolster the research's credibility. For instance, we may refrain from delving deeply into a particular topic and clarify the constraints on the generalizability of our findings.

The proposed methodology in this study holds the potential to facilitate the effective handling and utilization of this vast text data reservoir. Furthermore, if this methodology is applied to Korean exporters, it could play a pivotal role in transforming existing export support services and mitigating the recent trade deficit.

3. Literature review
3.1 Non-graph-based method
3.1.1 Latent Dirichlet Allocation (LDA)

LDA, a classic topic modeling technique, discovers hidden topics within a corpus by assigning words to topics probabilistically[2]. It uncovers hidden 'topics' within a corpus by probabilistically assigning words in documents to these topics. Each document is viewed as a mixture of topics, and each topic is characterized by a distribution of words and topic probabilities.

\[p(d|\alpha,\beta^v_{z_n}) = \int{p(\theta_d|\alpha)} \prod_{n} \sum_{z_n} p(w_{d,n}|z_n,\beta^v_{z_n})p(z_n|\theta_d)d\theta_d \]

where \(\beta\) is \(k\times V\) topic-word matrix. \(p(w_{d,n}|z_n,\beta^v_{z_n})\) is probability for word \(w_{d,n}\) to happen when topic is \(z_n\).

However, LDA has a limitation known as the "independence" problem. It treats words as independent and doesn't consider their order or relationships within documents. This simplification can hinder LDA's ability to capture contextual dependencies between words. To address this, models like Word2Vec and GloVe have been developed, taking word order and dependencies into account to provide more nuanced representations of textual data.

3.1.2 Latent Semantic Analysis (LSA)

LSA is a method to uncover the underlying semantic structure in textual data. It achieves this by assessing the semantic similarity between words using document-word matrices[4]. LSA's fundamental concept involves recognizing semantic connections among words based on their distribution within a document. To accomplish this, LSA relies on linear algebra techniques, particularly Singular Value Decomposition (SVD), to condense the document-word matrix into a lower-dimensional representation. This process allows semantically related words or documents to be situated in proximity within this reduced space.

\[X=U\Sigma V^T\]

\[Sim(Q,X)=R=Q^T X\]

where \(X\) is \(t \times d\) matrix, a collection of d documents in a space of t dictionary terms. \(Q\) is \(t \times q\) matrix, a collection of q documents in a space of t dictionary terms.

\(U\) is term eigenvectors and \(V\) is document eigenvectors.

LSA, an early form of topic modeling, excels at identifying semantic similarities among words. Nonetheless, it has its limitations, particularly in its inability to fully capture contextual information and word relationships.

3.1.3 Neural Topic Model (NTM)

Traditional topic modeling has limitations, including sensitivity to initialization and challenges related to unigram topic distribution. The Neural Topic Model (NTM) bridges topic modeling and deep learning, aiming to enhance word and document representations to overcome these issues.

At its core, NTM seamlessly combines word and document representations by embedding topic modeling within a neural network framework. While preserving the probabilistic nature of topic modeling, NTMs represent words and documents as vectors, leveraging them as inputs for neural networks. This involves mapping words and documents into a shared latent space, accomplished through separate neural networks for word and document vectors, ultimately leading to the computation of the topic distribution.

The computational process of NTM includes training using back-propagation and inferring topic distribution through Bayesian methods and Gibbs sampling.

\[p(w|d) = \sum^K_{i=1} p(w|t_i)p(t_i|d)\]

where \(t_i\) is a latent topic and \(K\) is the pre-defined topic number. Let \(\pi(w) = [p(w|t_1), \dot , p(w|t_K)]\) and \(\theta(d) = [p(t_1|d), \dot, p(t_K|d)]\), where \(\pi\) is shared among the corpus and \(\theta\) is document-specific.

Then above equation can be represented as the vector form:

\[p(w|d) = \phi(w) \times \theta^T(d) \]

3.2 Graph-based methods
3.2.1 Global random topic field

To capture word dependencies within a document, the graph structure incorporates topic assignment relationships among words to enhance accuracy[9].

GloVe-derived word vectors are mapped to Euclidean space, while the document's internal graph structure, identified as the Word Graph, operates in a non-Euclidean domain. This enables the Word Graph to uncover concealed relationships that traditional Euclidean numerical data representation cannot reveal.

Calculating the "structure representing word relationships" involves employing a Global Random Field (GRF) that encodes the graph structure in the document using topic weights of words and the topic connections in the graph's edges. The GRF formula is as follows:

\[ p(G) = f_G (g) = \frac{1}{|E|} \phi(z_W) \sum {(w', w'') \in E} \phi(z{w'}, z_{w''}) \]

The above-described Global Topic-Word Random Field (GTRF) shares similarities with the GRF. In the GTRF, the topic distribution (z) becomes a conditional distribution on \(theta\). Learning and inferring in this model closely resemble the EM algorithm. The outcome, denoted as \(p_{GTRF}(z|\theta)\), represents the probability of the graph structure considering whether neighboring words (w' and w'') are assigned to the same topic or different topics. This is expressed as:

\[ p_{GTRF}(z|\theta) = \frac{1}{|E|} Multi(z_W|\theta) \times \sum {(w', w'') \in E} (\sigma{z_{w'} = z_{w''}}\lambda_1 + \sigma_{z_{w'} \neq z_{w''}}\lambda_2) \]

Where \(\sigma_{z}\) is a function that returns 1 if the condition $x$ is true and 0 if $x$ is false.

3.2.2 GraphBTM

While LDA encounters challenges related to data sparsity, particularly when modeling short texts, the Biterm Topic Model (BTM) faces limitations in its expressiveness, especially when dealing with documents containing diverse topics[13]. Additionally, BTM relies on bitwords in conjunction with the co-occurrence features of words, which restricts its suitability for modeling longer texts.

To address these limitations, the Graph-Based Biterm Topic Model (GraphBTM) was developed. GraphBTM introduces a graphical representation of biterms and employs Graph Convolutional Networks (GCN) to extract transitive features, effectively overcoming the shortcomings associated with traditional models like LDA and BTM.

GraphBTM's computational approach relies on Amortized Variational Inference. This method involves sampling a mini-corpus to create training instances, which are subsequently used to construct graphs and apply GCN. The inference network then estimates the topic distribution, which is vital for training the model. Notably, this approach has demonstrated the capability to achieve higher topic consistency scores compared to traditional Auto-Encoding Variational Bayes (AEVB)-based inference methods.

3.2.3 Graphical Neural Topic Model (GNTM)

LDA, in its conventional form, makes an assumption of independence. It posits that each document is generated as a blend of topics, with each topic representing a distribution over the words within the document. However, this assumption of conditional independence, also known as exchangeability, overlooks the intricate relationships and context that exist among words in a document.

The No Variational Inference (NVI) algorithm presents a departure from this independence assumption. NVI is a powerful technique for estimating the posterior distribution of latent topics in text data. It leverages a neural network structure, employing a reparameterization trick to accurately estimate the genuine posterior distribution for a wide array of distributions.

\[\alpha(prior) \rightarrow z(topic) \: from \: \theta \rightarrow G_d(structure) \rightarrow V(word \: set) \]

\[p(G^0_d|Z_d;M) = \prod_{(n,n') \in E^0_d} m_{z_{d,n}}{z_{d,n'}} \prod_{(n,n') \notin E^0_d} (1-m_{z_{d,n}}{z_{d,n'}})\]

\[p(G_d, \theta_d, Z_d;\alpha) = p(V_d|Z_d,G^0_d)p(G^0_d|Z_d)\prod^{N_d}_{n=1} p(z_{d,n}|\theta_d)p(\theta|\alpha) \]

Unlike the Variational Autoencoder (VAE), which is primarily employed for denoising and data restoration and can be likened to an 'encoder + decoder' architecture, NVI serves a broader purpose and can handle a more extensive range of distributions. It's based on the mean-field assumption and employs the Laplace approximation method, replacing challenging distributions like the Dirichlet distribution with the computationally efficient logistic normal distribution[8].

Based mean field assumption:

\[q(\theta_d,Z_d|G_d) = q(\theta_d|G_d;\mu_d, \delta_d) \prod^{N_d}_{n=1} q(z_{d,n}|G_d,w_d,n;\varphi_{d,n})\]

\[L_d = E_{q(Z_d|G_d)} [log p(G^0_d|Z_d;M) + logp(V_d|Z_d, G^0_d;\beta)] - KL[q(\theta_d|G_d)||p(\theta_d)] - E_{q(\theta_d|G_d)}\sum^{N_d}_{n=1} KL[q(z_{d,n}|G_d, w_{d,n})||p(z_{d,n}|\theta_d)]
\]

This substitution simplifies parameter estimation, making it more tractable and readily differentiable. In the context of the Global Neural Topic Model (GNTM), the logistic normal distribution facilitates the approximation of correlations between latent variables, allowing for the utilization of dependencies between topics. Additionally, the Evidence Lower Bound (ELBO) in NVI is differentiable in closed-form, enhancing its applicability.

The concept of topic proportion is represented by the equation:

\[\theta_d = \text{softmax}(N(\mu_d, \delta_d^2))\]

\[f_X(x;\mu,\sigma) = \frac{1}{\sigma \sqrt{2\pi}}e^{\frac{(logit(x)-\mu)^2}{2\sigma^2}}\frac{1}{x(1-x)}\]

This equation encapsulates the distribution of topics within a document, reflecting the proportions of different topics in that document.

Figure 2. Transformation of logit-normal distribution after conversion
3.3 Visualization techniques
3.3.1 Fast unfolding of communities in large networks

This algorithm aids in detecting communities within topic-words networks, facilitating interpretation and understanding of topic structures.

3.3.2 Uniform Manifold Approximation and Projection (UMAP)

UMAP is a nonlinear dimensionality reduction technique that preserves the underlying structure and patterns of high-dimensional data while efficiently visualizing it in lower dimensions. It outperforms traditional methods like t-SNE in preserving data structure.

3.3.3 Agglomerative Hierarchical Clustering

Hierarchical clustering is an algorithm that clusters data points, combining them based on their proximity until a single cluster remains. It provides a dynamic and adaptive way to maintain cluster structures, even when new data is added.

Additionally, several evaluation metrics, including the Silhouette score, Calinski-Harabasz index, and Davies-Bouldin index, assist in selecting the optimal number of clusters for improved data understanding and analysis.

4. Method
4.1 Graphical Neural Topic Model(GNTM) as Factor analysis

GNTM can be viewed from a factor analysis perspective, as it employs concepts similar to factor analysis to unveil intricate interrelationships in data and extract topics. GNTM can extract \(\theta\), which signifies the proportion of topics in each document, for summarizing and interpreting document content. In this case, \(\theta\) follows a logistic normal distribution, enabling the probabilistic modeling of topic proportions.

The \(\theta\) can be represented as follows[1][7]:

\[ \tilde{\theta} \sim \text{LN}(\mu, \sigma^2) \]

For \(0 < \tilde{x} < 1\) and \(\sum_i^K x_i = 1\):

\[ y = [\log(\frac{x_1}{x_D}), ..., \log(\frac{x_{D-1}}{x_D})]^T \]

Probability Density Function (PDF) for \(X\):

\[ f_X(x; \mu, \Sigma) = \frac{1}{|2 \pi \Sigma|^{\frac{1}{2}}} \frac{1}{\prod^K_{i=1} x_i (1-x_i)} e^{-\frac{1}{2} \{ \log (\frac{x}{1-x}) - \mu \} \Sigma^{-1} \{ \log(\frac{x}{1-x}) - \mu \}} \]

where the log and division in the argument are element-wise. This is due to the diagonal Jacobian matrix of the transformation with elements \(\frac{1}{{x_i}{(1-x_i)}}\)

GNTM shares similarities with factor analysis, which dissects complex data into factors associated with each topic to unveil the data's structure. In factor analysis, the aim is to explain observed data using latent factors. Similarly, GNTM treats topics in each document as latent variables, and these topics contribute to shaping the word distribution in the document. Consequently, GNTM decomposes documents into combinations of words and topics, offering an interpretable method for understanding document similarities and differences.

4.2 Akaike Information Criteria (AIC)

The Akaike Information Criterion (AIC) is a crucial statistical technique for model selection and comparison, evaluating the balance between a model's goodness of fit and its complexity. AIC aids in selecting the most appropriate model from a set of models.

In the context of this thesis, AIC is employed to assess the fit of a Graphical Network Topic Model (GNTM) and determine the optimal model. Since GNTMs involve parameters related to the number of topics in topic modeling, selecting the appropriate number of topics is a significant consideration. AIC assesses various GNTM models based on the choice of the number of topics and assists in identifying the most suitable number of topics.

AIC can be represented by the following formula:

\[ AIC = -2 \cdot \text{log-likelihood} + 2 \cdot \text{number of parameters} \]

Where:

  • The \(\text{log-likelihood}\) is a measure of the goodness of fit of the model to explain the data.
  • Number of parameters indicates the count of parameters in the model.

AIC weighs the tradeoff between a model's log-likelihood and the number of parameters, which reflects the model's complexity. Lower AIC values indicate better data fit while favoring simpler models. Therefore, the model with the lowest AIC is considered the best. AIC plays a pivotal role in enhancing the quality of topic modeling in GNTM by assisting in managing model complexity when choosing the number of topics.

For our current model, following a Logistic Normal Distribution, we utilize GNTM's likelihood:

\[ L(\theta| D) = \prod_{d=1}^D \left[-\frac{1}{2} \log(|2 \pi \Sigma|) - \sum_{i=k}^K (\log\theta_i - \log(1-\theta_i)) - \frac{1}{2} \left\{ \log \left(\frac{\theta}{1-\theta}\right) - \mu \right\} \Sigma^{-1} \left\{ \log \left(\frac{\theta}{1 - \theta}\right) - \mu \right\}\right] \]

When applied to a formula, it appears as:

\[ AIC = -2 \cdot l(\theta) + 2 \cdot \text{number of topics} \]

Where:

  \[ l(\theta) = \sum_{d=1}^D [ -\frac{1}{2}\log (|2\pi \Sigma|) - \sum_{k=1}^K \log(\theta_k (1 - \theta_k)) + -\frac{1}{2} (\log(\frac{\theta}{1-\theta}) - \mu_i)^T \Sigma^{-1} (\log(\frac{\theta}{1-\theta}) - \mu_i)] \]

This encapsulates the essence of GNTM and AIC in evaluating and selecting models.

5. Result
5.1 Model setup
5.1.1 Data

The data consists of news related to the top 200 companies by market capitalization on the NASDAQ stock exchange. These news articles were collected by crawling Newsdata.io in August. Analyzing this data can provide insights into the trends and information about companies that occurred in August. Having a specific timeframe like August helps in interpreting the analysis results clearly.

To clarify the research objectives, companies with fewer than 10 articles collected were excluded from the analysis. Additionally, a maximum of 100 articles per company was considered. As a result, a total of 13,896 documents were collected, and after excluding irrelevant documents, 13,816 were used for the analysis. The data format is consistent with the "20 News Groups" dataset, and data preprocessing methods similar to those in Shen(2021)[10] were applied. This includes steps like removing stopwords, abbreviations, punctuation, tokenization, and vectorization. You can find examples of the data in the Appendix.

5.1.2 Parameters

"In our experiments, as the dataset contained a large number of words and edges, it was necessary to reduce the number of parameters for training while minimizing noise and capturing important information. To achieve this, we set the threshold for the number of words and edges to 140 and 40, respectively, which is consistent with the configuration used in the BNC dataset, a similar dataset. The experiments were conducted in an RTX3060 GPU environment using the CUDA 11.8 framework, with a batch size of 25. To determine the optimal number of topics, we calculated and compared AIC values for different numbers of topics. Based on the comparison of AIC values, we selected 20 as the final number of topics."

5.2 Evaluation
5.2.1 AIC
Figure 3. Changes in AIC values depending on the number of topics

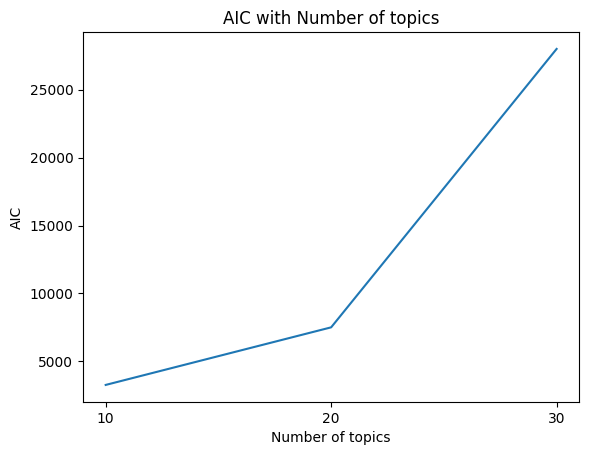
AIC is used in topic modeling as a tool to select the optimal number of topics. However, AIC is a relative number and may vary for different data or models. Therefore, when using AIC to determine the optimal number of topics, it is important to consider how this metric applies to your data and model.

In our study, we calculated the AIC for a given dataset and model architecture and used it to select the optimal number of topics. This approach served as an important metric for finding the best number of topics for our data. The AIC was used to evaluate the goodness of fit of our model, allowing us to compare the performance of the model for different numbers of topics.

Additionally, AIC allows us to evaluate the performance of our model in comparison to AICs obtained from other models or other datasets. This allows us to determine the relative superiority of our model and highlights that we can perform optimized hyperparameter tuning for our own data and model, rather than comparing to other models. This approach is one of the key strengths of our work, contributing to a greater emphasis on the effective utilization and interpretation of topic models.

5.2.2 Topic interpretation
5.2.3 Classification
Figure 4a*. 10 Topics graph
Figure 4b*. 30 Topics graph: *The result of Agglomerative Clustering

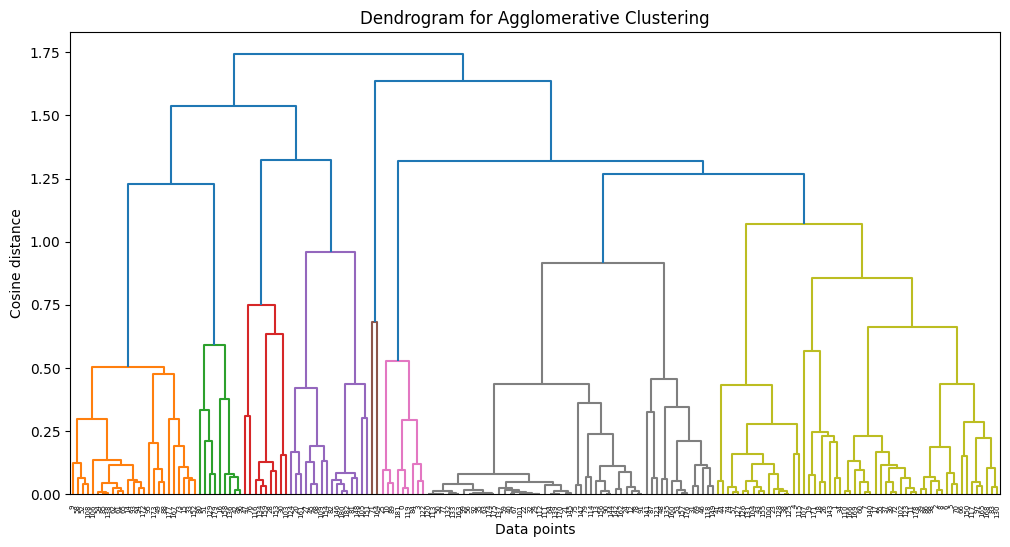
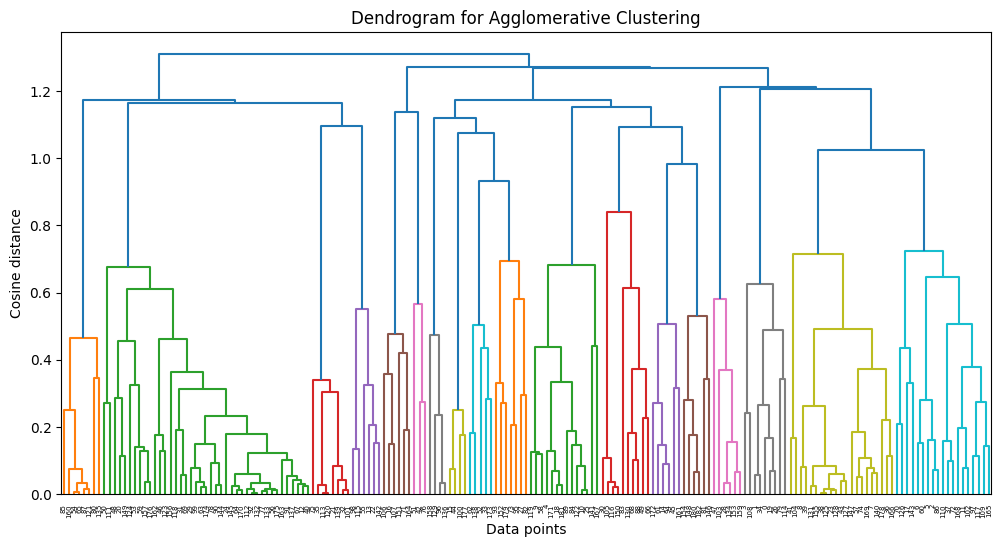
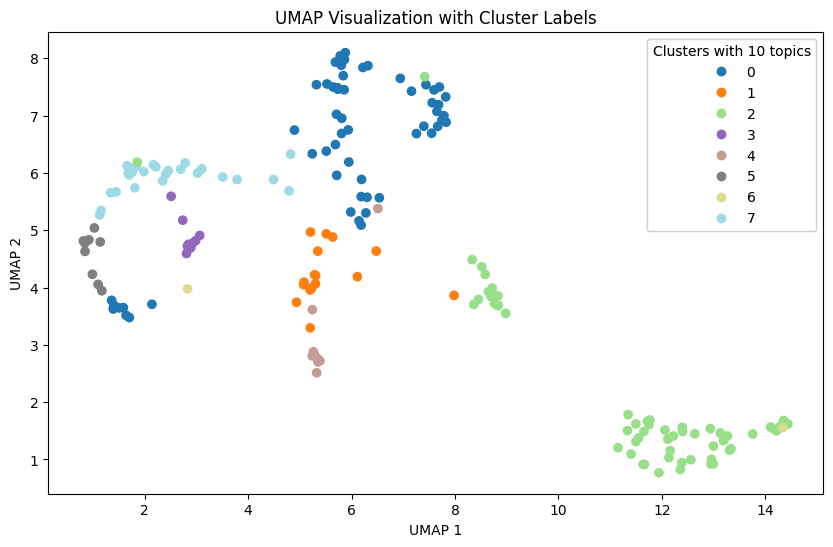
In our study, we leveraged Agglomerative Clustering and UMAP to classify and visualize news data. In our experiments, we found that news is generally better classified when the number of topics is 10. These results suggest that the model is able to group and interpret the given data more effectively.

However, when the number of topics is increased, broader topics tend to be categorized into more detailed topics. This results in news content being broken down into relatively more detailed topics, but the main themes may not be more apparent.

Figure 5a*. UMAP graph with 10 topics
Figure 5b*. UMAP graph with 20 topics
Figure 5c*. UMAP graph with 30 topics: *The result of Agglomerative Clustering

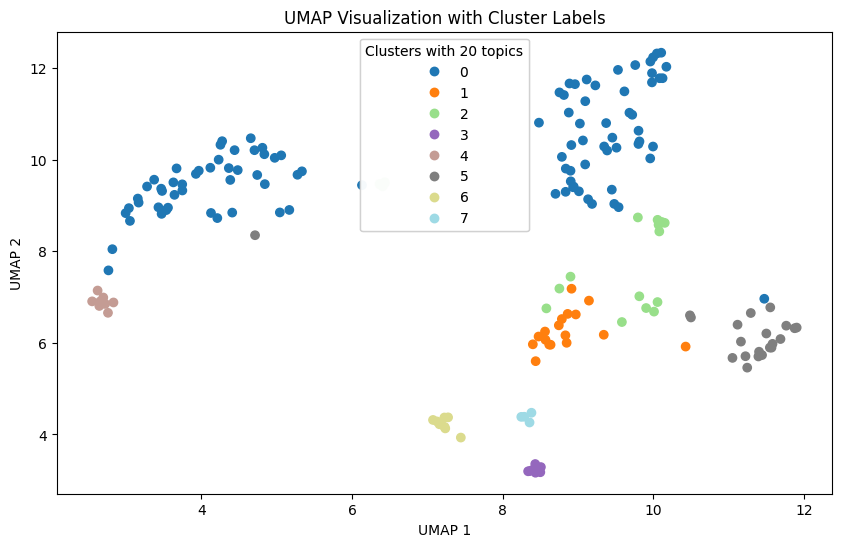
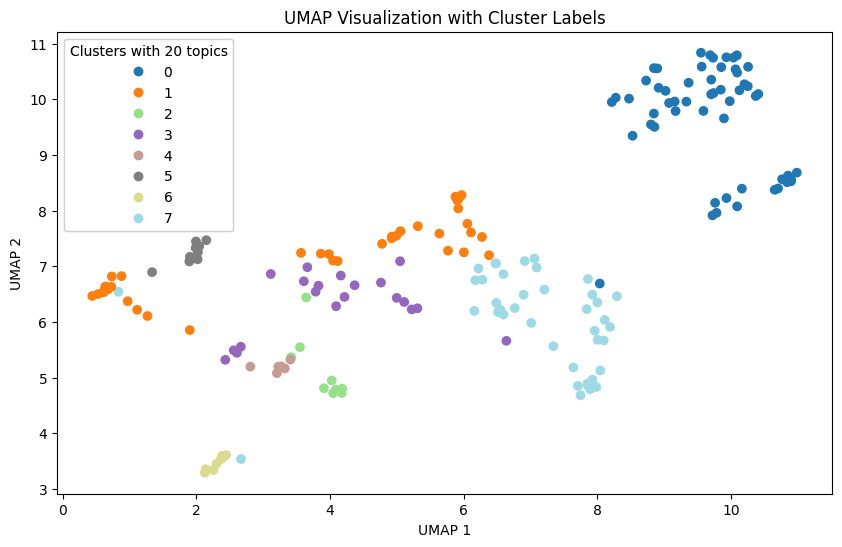
Also, as the number of topics increases, the difference in the proportion of topics that represent the nature of the news increases. This indicates a hierarchy between major and minor topics, which can be useful when you want to fine-tune your investigation of different aspects of the news. This diversity provides important information for detailed topic analysis in context.

Therefore, when choosing the number of topics, we need to consider the balance between major and minor topics. By choosing the right number of topics, the model can best understand and interpret the given data, and we can tailor the results of the topic analysis to reflect the key features of the news content.

6. Discussion
6.1 Limitation

Even though this paper has contributed to addressing various challenges related to textual data analysis, it is essential to acknowledge some inherent limitations in the proposed methodology:

  1. Noise Edges Issue
    The modeling approach used in this paper introduces a challenge related to noise edges in the data, which can be expected when dealing with extensive corpora or numerous documents from various sources.
    To effectively mitigate this noise issue, it is crucial to implement regularization techniques tailored to the specific objectives and nature of the data. Approaches such as the one proposed by Zhu et al. (2023)[12] enhanced the model’s performance by more efficiently discovering hidden topic distributions within documents.}
  2. Textual Data Versatility
    While this paper focuses on extracting and utilizing the topic latent space from text data, it is worth noting that textual data analysis can have diverse applications across various fields.
    In addition to hierarchical clustering, there is potential to explore alternative recommendation models, such as Matrix Factorization methods like NGCF(Neural Graph Collaborative Filtering)[11]{Wang2019} and LightGCN(Light Graph Convolutional Network)[6], which utilize techniques like Graph Neural Networks(GNN) for enhancing recommendation performance.

Acknowledging these limitations is essential for a comprehensive understanding of the proposed methodology's scope and areas for potential future research and improvement.

6.2 Future work

While this study has made significant strides in addressing key challenges in the analysis of textual data and extracting valuable insights through topic modeling, there remain several avenues for future research and improvement:

  1. Enhanced Noise Handling
    The modeling used has shown promise but is not immune to noise edge issues often encountered in extensive datasets. In this study, we used a dataset comprising approximately 9,000 news articles from 194 countries, totaling around 5 million words. To mitigate these noise edge issues effectively, future work can focus on developing advanced noise reduction techniques or data preprocessing methods tailored to specific domains, further enhancing the quality of extracted topics and insights.
  2. Cross-Domain Application
    While the study showcased its effectiveness in the context of news articles, extending this approach to other domains presents an exciting opportunity. Adapting the model to different domains may require domain-specific preprocessing and feature engineering, as well as considering transfer learning approaches. Models based on Graph Neural Networks (GNN) and Matrix Factorization, such as Neural Graph Collaborative Filtering (NGCF) and LightGCN, can be employed to enhance recommendation systems and knowledge discovery in diverse fields. This cross-domain versatility can unlock new possibilities for leveraging textual data to extract meaningful insights and improve decision-making processes across various industries and research domains.
7. Conclusion

In the context under discussion, the term "group information" pertains to the topic proportions represented by theta. From my perspective, I have undertaken an endeavor that can be characterized as Non-Linear Factor Analysis (FA) applied to textual data, analogous to traditional FA methods employed with numerical data. This undertaking proved intricate due to the inherent non-triviality in its extraction, thus warranting the classification as Non-Linear FA. (Indeed, there exists inter-topic covariance.)

Hitherto, the process has encompassed the extraction of information from textual data, a task which may appear formidable for utilization. This encompasses the structural attributes of words and topics, the proportions of topics, as well as insights into the prior distribution governing topic proportions. These constituent elements have facilitated the quantitative characterization of information within each group.

A central challenge encountered in the realm of conventional Principal Component Analysis (PCA) and FA techniques lies in the absence of definitive answers, given our inherent limitations. Consequently, the interpretation of the extracted factors poses formidable challenges and lacks assuredness. However, the GNTM methodology applied to this paper, in tandem with textual data, furnishes a network of words for each factor, thereby affording a means for expeditious interpretation.

If the words assume preeminence within Topic 1, they afford a basis for interpretation. This alignment with the intentions of the GNTM. In effect, this model facilitates the observation of pivotal terms within each topic (factor) and aids in the explication of their conceptual representations.

This research has presented a comprehensive methodology for the analysis of textual data using Graphical Neural Topic Models (GNTM). The paper discussed how GNTM leverages the advantages of both topic modeling and graph-based techniques to uncover hidden patterns and structures within large text corpora. The experiments conducted demonstrated the effectiveness of GNTM in extracting meaningful topics and providing valuable insights from a dataset comprising news articles.

In conclusion, this research contributes to advancing the field of textual data analysis by providing a powerful framework for extracting interpretable topics and insights. The combination of GNTM and future enhancements is expected to continue facilitating knowledge discovery and decision-making processes across various domains.

Nevertheless, a pertinent concern arises about inordinate amount of noise pervade newspaper data or all data. Traditional methodologies employ noise mitigation techniques such as Non-Negative Matrix Factorization (NVI) and the execution of numerous epochs for the extraction of salient tokens. In the context of this research, as aforementioned, the absence of temporal constraints allowed for the execution of epochs as deemed necessary.

However, computational efficiency was bolstered through the reduction in the number of topics, while remaining the primary objectives from a clustering perspective by finding out the optimized number of topic by AIC and agglomerative clustering. This revealed that a reduction in the number of topics resulted in the observation of words associated with the original topics within sub-networks of the diminished topics.

Future research can further enhance the capabilities of GNTM by improving noise handling techniques and exploring cross-domain applications.

References

[1] Atchison, J., and Shen, S. M. Logistic-normal distributions: Some properties and uses.
Biometrika 67, 2 (1980), 261–272.

[2] Blei, D. M., Ng, A. Y., and Jordan, M. I. Latent dirichlet allocation. Journal of machine
Learning research 3, Jan (2003), 993–1022.

[3] Choi, M. J., and Kim, K. K. Import demand in developed economies. In Economic Analysis
(Quarterly) (2019), vol. 25, Economic Research Institute, Bank of Korea, pp. 34–65.

[4] Evangelopoulos, N. E. Latent semantic analysis. Wiley Interdisciplinary Reviews: Cognitive
Science 4, 6 (2013), 683–692.

[5] Han, K. J. Analysis and implications of overseas market provision system based on domestic
logistics big data. KISDI AI Outlook 2022, 8 (2022), 17–30.

[6] He, X., Deng, K., Wang, X., Li, Y., Zhang, Y., and Wang, M. Lightgcn: Simplifying and
powering graph convolution network for recommendation. In Proceedings of the 43rd International
ACM SIGIR conference on research and development in Information Retrieval (2020), pp. 639–
648.

[7] Hinde, J. Logistic Normal Distribution. Springer Berlin Heidelberg, Berlin, Heidelberg, 2011,
pp. 754–755.

[8] Kingma, D. P., and Welling, M. Auto-encoding variational bayes. arXiv preprint
arXiv:1312.6114 (2013).

[9] Li, Z., Wen, S., Li, J., Zhang, P., and Tang, J. On modelling non-linear topical dependencies.
In Proceedings of the 31st International Conference on Machine Learning (Bejing, China,
22–24 Jun 2014), E. P. Xing and T. Jebara, Eds., vol. 32 of Proceedings of Machine Learning
Research, PMLR, pp. 458–466.

[10] Shen, D., Qin, C., Wang, C., Dong, Z., Zhu, H., and Xiong, H. Topic modeling revisited:
A document graph-based neural network perspective. Advances in neural information processing
systems 34 (2021), 14681–14693.

[11] Wang, X., He, X., Wang, M., Feng, F., and Chua, T.-S. Neural graph collaborative
filtering. In Proceedings of the 42nd International ACM SIGIR Conference on Research and
Development in Information Retrieval (jul 2019), ACM.

[12] Zhu, B., Cai, Y., and Ren, H. Graph neural topic model with commonsense knowledge.
Information Processing Management 60, 2 (2023), 103215.

[13] Zhu, Q., Feng, Z., and Li, X. Graphbtm: Graph enhanced autoencoded variational inference
for biterm topic model. In Proceedings of the 2018 conference on empirical methods in natural
language processing (2018), pp. 4663–4672.

Appendix

News Data Example
Google courts businesses with ramped up cloud AI Synopsis The internet giant unveiled new AI-powered features for data searches, online collaboration, language translation, images and more at its first annual Cloud Next conference held in-person since 2019. AP Google on Tuesday said it was weaving artificial intelligence (AI) deeper into its cloud offerings as it vies for the business of firms keen to capitalize on the technology. The internet giant unveiled new AI-powered features for data searches, online collaboration, language translation, images and more at its first annual Cloud Next conference held in-person since 2019. Elevate Your Tech Process with High-Value Skill Courses Offering College Course Website Indian School of Business ISB Product Management Visit Indian School of Business ISB Digital Marketing and Analytics Visit Indian School of Business ISB Digital Transformation Visit Indian School of Business ISB Applied Business Analytics Visit The gathering kicked off a day after OpenAI unveiled a business version of ChatGPT as tech companies seek to keep up with Microsoft , which has been ahead in powering its products with AI. "I am incredibly excited to bring so many of our customers and partners together to showcase the amazing innovations we have been working on," Google Cloud chief executive Thomas Kurian said in a blog post. Most companies seeking to adopt AI must turn to the cloud giants -- including Microsoft, AWS and Google -- for the heavy duty computing needs. Those companies in turn partner up with AI developers -- as is the case of a major tie-up between Microsoft and ChatGPT creator OpenAI -- or have developed their own models, as is the case for Google.

Price Premium Discovery In Real Estate Auction Market: Decomposition Of The Korea Auction Sale Rate

Price Premium Discovery In Real Estate Auction Market: Decomposition Of The Korea Auction Sale Rate

Bohyun Yoo*

* Swiss Institute of Artificial Intelligence, Chaltenbodenstrasse 26, 8834 Schindellegi, Schwyz, Switzerland

Abstract

This study discovers and analyzes price premium (discount/surcharge) factors in the real estate auction market. Unlike existing bottom-up studies based on individual auction cases, a top-down time-series analysis is conducted, assuming that the price premium factor varies over time. To overcome limitations such as the difference between the court appraisal time* and the auctioned time, and the difficulty of using external data on court appraisals and price premium factors, the Fourier transform is utilized to extract the court appraisals and price premium factors in reverse. The extracted components are verified to determine if they can play a role as each factor. The price premium factor is found to have a similar movement to the difference in past values of the auction sale rate, and, as it signifies the discounts/surcharges in the auction market compared to the general market, it is named the “momentum factor”. Furthermore, by leveraging the momentum factor, the price premium can be differentiated by region, and the extent of the price premium applied can be distinguished over various time periods compared to the general market. Given the clustering tendency, the momentum factor can be a significant indicator for auction market participants to detect market changes.

1. Introduction

The housing auction market in Korea is one of the real estate markets, and many stakeholders such as mortgage banks, arbitrage investors, and non-performing loan operators are deeply involved. In general, there is a perception that the auction market is surcharged or discounted compared to the general market. If the auction market is an efficient and fair-trading market, it will not be different from the general market price, but most housing auction cases are implemented by default, so it is known that have legal issues and that applies as a discount factor. However, the bottom-up analysis based on individual auction cases, which is a method mainly used in previous studies on discounts and surcharges, is limited in time and space, and the time-varying effect cannot be considered, and the results of the analysis are limited and dependent on the data held by the researcher.

To overcome these limitations, it should be carried out the analysis from the market perspective, but the time series data Auction Sale Rate is unreliable as an indicator because the court appraiser price, which is the standard, is performed at the past rather than at the time of the auctioned price. It is difficult to specify the time of court appraisal as a variable in the model because it varies from case to case of individual auction how much it is in the past at the time of successful bid, and even if the time is known, the court appraisal price cannot be accurately estimated. Individual cases can be investigated in a bottom-up manner to return the point of view based on the general market price, but it is a very vast task and likewise a study limited to time and space.

The target of this paper is the apartment auction market, and to overcome the limitations of the auction sale rate, the auction sale rate is decomposed into three components in a top-down manner using Fourier transform. The proof of the decomposed each component is performed. And the price premium effect at the auction market is presumed and the reason is analyzed and the section discrimination in which the price premium effect acts is attempted. In addition, the time-varying beta through the Kalman filter is used to support the price premium effect, and the analysis of how the price premium effect differs in each region's market is also performed.

2. Literature review

Shilling et al (1990) analyzed the apartment auction in 1985 in the baton lounge, Louisiana, USA, and found an auction discount rate of -24%, Forgey et al (1994) analyzed houses from 1991 to 1993 in the United States and found that they were traded at a -23% discount. Spring (1996) analyzed foreclosures in Texas from 1991 to 1993 and found a 4-6% discount, Clauretie and daneshvary (2009) analyzed the housing auctions from 2004 to 2007 and found that about 7.5% of foreclosures were discounted because of endogenous and autocorrelation.

Campbell et al (2011) analyzed about 1.8 million housing transactions in Massachusetts and found that the discount rates for foreclosures and deaths were different. Zhou et al (2015) found that on average, 16 cities in the United States were discounted by 14.7%, Arslan, Guler & Tasking (2015) analyzed that a 1% increase in risk-free interest rates led to a 27% drop in house prices and a 3% increase in foreclosure rates.Jin (2010) compared and analyzed the general sale price and the auction price of apartments in Dobong-gu, Seoul and Suji-gu, Yongin-si, Korea, and found that the auction price is more discounted than the general transaction price. Lee (2012) noted that the real estate market is not efficient and is one of the anomalies of the discount / surcharge phenomenon in the apartment auction market.

Lee (2009) and Oh (2021) pointed out the limitations that occurred when the court appraisal price and the auctioned price were different and estimated the auction sale rate by correcting the court appraisal price to the auctioned time.

However, previous studies mainly focus on the analysis of variables in the bottom-up method along with the limitation of space and time based on individual auction cases. In addition, it is difficult to see the analysis in the same environment as Korea because the cases other than Korea adopt the open bidding system.

3. Materials and method
3.1. Decomposition of auction sale rate

Configuration of the auction sale rate defined as

\begin{equation} \label{eq:auction-sale-rate}
Auction\ Sale\ Rate\ _t=\frac{\sum_{i}\ Auctioned\ Price_{it}}{\sum_{i}\ Appraisal\ Price_{it-n}}\
\end{equation}

\begin{equation} \label{eq:auction-price}
Auctioned\ Price_t=\ Market\ Price_t\pm\ Price\ Premium_t\ (=discount\ or\ surcharge)
\end{equation}

\begin{equation} \label{eq:auction-sale-rate-price}
Auction\ Sale\ Rate\ _t=\frac{\sum_{i}\ (Market\ Price_t\ \pm\ Premium\ _t)}{\sum_{i}\ Appraisal\ Price_{t-n}}
\end{equation}

\begin{equation} \label{eq:market-price}
\text{If}\ Price\ Premium_t=0\ ,\ \ Market\ Price_t=Auctioned\ Price_t
\end{equation}

Where i is each auction case, t is each per month. If the auctioned price is discounted and surcharged compared to the general market price, the component can be separated as shown in (2), and if there is no discount and surcharge, it can be expressed as shown in (4). In order to estimate the price premium effect, which is the discount or surcharge, it can be defined in the Regression form as shown in (5), and it is assumed that the explanatory power of each component is as shown in (6).

In the Regression form in terms of effects,

\begin{equation} \label{eq:auction-sale-rate-in-regression}
Auction\ Sale\ Rate\ _t={\beta_0}_t{+\beta}_1EoM+\beta_2EoA_t+\ \beta_3EoP_t+\epsilon_t
\end{equation}

\begin{equation} \label{eq:explanatory-power}
\text{Explanatory Power of Each Components :} \\
EoM (Effect of Market Price) > EoA (Effect of Appraisal Price) > EoP (Effect of Price Premium)
\end{equation}

3.2. The data

The empirical analysis in this paper is based on Auction Sale Rate and Market Price Index in nationwide 2012.03 ~ 2022.10 in month. The auction sale rate is calculated by collecting the sum of court appraiser prices and auctioned prices nationwide announced by the court from 2012.03 to 2022.10. The Market price index is an index of general market apartment prices nationwide and is provided by the Korea Real Estate Board. Log-Differencing is taken in the Market price index to match the forms of both data equally then Standardization, which translates to mean 0 and variance 1, take both data to match the same scale.

Table 1. Data Description BoHyunYoon
Figure 1. Auction Sale Rate and Market Price Index
Figure 2. Comparison of Standardized Auction Sale Rate and Market Price Index (Log-differencing)

skewness and kurtosis reported in Table 1 shows AuctionSaleRate and MarketPriceIndex has different peaks and tails compared to normal distribution. and the Lev results in Table 1 show that it is different from the leverage effect (Black 1976.) of the stock market. The auction market and the general sales market has a positive sign relationship with the future volatility. This means that volatility in the real estate market has a positive correlation with price.

3.3. Identification of variables
3.3.1. The effect of market price

Auction sale rate can be decomposed into three components in the regression form as shown in (5), and log-differencing market price index is used as the first variable, EoM's proxy variable. As shown in Table 2, EoM has the strongest explanatory power in auction sale rate.

3.3.2. Component identification

\begin{equation} \label{eq:component-identification}
y_t=\beta_0+\beta_1Mkt_t+\epsilon_t
\end{equation}

Where y_t is Auction sale rate at time t, $\beta_0$ is intercept $\beta_1$ is parameter of $Mkt$ and $Mkt$ is Log differencing Market Price Index. as define in (5), the remaining EoA and EoP components are in the residual as latent. To identify EoA, EoP components, a Fourier transform is used in $\epsilon_t$ (7), and then two highest amplitude signals can be extracted, assuming that they are court appraisers and price premium effects as defined in (6).

3.3.2.1. Fourier transform

Fourier transform is a mathematical transformation that decomposes a function into a frequency component, representing the output of the transformation as a frequency domain. In this paper, it is used to extract the orthogonal cycle of EoA and EoP as defined in (5). In terms of linear transformation, the orthogonal factor present in the signal can be extracted as a Forward and Inverse Discreate Fourier matrix, as shown in (9).

\begin{equation} \label{eq:fft}
X=F_{N}x \ \text{and} \ x=\frac{1}{N}F_N^{-1}X\ \text{<Forward and Inverse>}
\end{equation}

\begin{equation} \label{eq:fft-in-matrix}
{\underbrace{\left[\begin{matrix}
X\left[0\right] \\
X\left[1\right] \\
\vdots \\
X\left[N-1\right] \\
\end{matrix}\right]}}_{Signal} \
= \
{\underbrace{\left[\begin{matrix}
W_N^{0\cdot0} & W_N^{0\cdot1} & \cdots & W_N^{0\cdot(N-1)} \\
W_N^{0\cdot1} & W_N^{0\cdot1} & \cdots & W_N^{1\cdot(N-1)} \\
\vdots & \vdots & \ddots & \vdots \\
W_N^{0\cdot1} & W_N^{0\cdot1} & \cdots & W_N^{(N-1)\cdot(N-1)} \\
\end{matrix}\right]}}_\text{$F_N$(Discrete Fourier Matrix)} \\
{\underbrace{\left[\begin{matrix}
x\left[0\right] \\
x\left[1\right] \\
\vdots \\
x\left[N-1\right] \\
\end{matrix}\right]}}_\text{Residual($\epsilon_t)$} \\
\text{, where } W^{n\cdot k}=\exp{\left(-j\frac{2\pi k}{N}n\right)}
\end{equation}

\begin{equation} \label{eq:signal-k}
X\left[k\right]=x\left[0\right]W^0+x\left[1\right]W^{N\times1}+\ldots+\ x\left[n-1\right]W^{i\times\left(n-1\right)} , \text{where} \ k=signal_k
\end{equation}

where $x$ is vector of $\epsilon$ in (7) $x=\left(x_0,x_1\ldots x_N\right)^T$ $N$ is length of vector and $X$ is signal $X=\left(X_0,X_1\ldots X_N\right)^T$ and $F_N$ is Discrete Fourier Matrix. As shown (9), (10) time series data which cyclic can be decomposed to orthogonal signal by Discrete Fourier Transform as linear transformation. However, in practice, DFT calculation $O(N^2)$ are replaced by Fast Fourier Transform (Cooley-Tukey algorithm, 1965) which is that performs fast calculations by dividing the DFT into odd and even two terms. $O\left({Nlog}_\ N\right)$ (11). Figure 3 shows that two high amplitude signals were extracted by performing FFT on Residual in (7).

\begin{equation} \label{eq:n-log-n}
\begin{split}
X\left[ k \right] & = \sum_{n=0}^{N-1} x_n \ exp \left( -j \frac{2 \pi k}{N} n \right) \\
& = \sum_{m=0}^{N/2-1}x_{2m}\exp{\left(-j\frac{2\pi k}{N}2m\right)}+\ \sum_{m=0}^{N/2-1}x_{2m+1}\exp{\left(-j\frac{2\pi k}{N}2m+1\right)} \\
& = \sum_{m=0}^{N/2-1}x_{2m}\exp{\left(-j\frac{2\pi k}{N\ /\ 2}\ m\ \right)}+\exp{\left(-j\frac{2\pi k}{N}\ \right)}\sum_{m=0}^{N/2-1}x_{2m+1}\exp{\left(-j\frac{2\pi k}{N/2}m\right)}
\end{split}
\end{equation}

where $x_{2m}=(x_0,x_1\ldots\ x_{n-2})$ is even-indexed part, $x_{2m+1}=(x_1,x_3,\ldots,x_{n-1})$ is odd-indexed part.

Figure 3-1. Transformed to Frequency Domain and Filtered by Amplitude
Figure 3-2. Transform Residual in (7) to FFT and extract signals
3.3.2.2. Regression analysis
Table 2. Result

\begin{equation} \label{eq:stage-2}
Y_t=\beta_0+\beta_1Mkt_t+\beta_2SI{G1}_t+\mu_t
\end{equation}

\begin{equation} \label{eq:stage-3}
Y_t=\beta_0+\beta_1Mkt_t+\beta_2SI{G1}_t+\beta_3\widehat{SIG2_t}+\omega_t
\end{equation}

\begin{equation} \label{eq:signal-2}
\widehat{Sig2_t}=\sigma\left(Sig2_t\right) , \ \sigma=\frac{1}{1+e^{-\left(x\right)}} , \ >\ 0.5\ =\ 1\ \ ,\ <0.5=\ 0
\end{equation}

where $SIG1$ is highest amplitude signal in residual in $\epsilon_t$ (7) and $SIG2$ is highest apmplitude signal residual in $\mu_t$ (12)

Table 2 shows the results of using the extracted signals as a variable of regression by performing FFT in 4.3.2.1. $SIG2$ is a component of EoP, and to distinguish price premium effects clearly, it is transformed into categorical data(0/1) through Sigmoid function as shown in (14). The Difference result in Table 2 show that the parameter has hardly changed, demonstrating that the two signals found are almost orthogonal components, and do not make omitted variable bias(Wooldridge, 2009). and the adj. R-squared supports the order of explanatory power assumed in (5). Lastly, the residual ACF/PACF plot in Figure 4 indicates that no further patterns exist in the residuals following the exclusion of the three components. (13) This supports the assumption outlined in 3.1 (5) that the auction sale rate is composed of three main components.

Figure 4. ACF/PACF Plot of Residual $\omega_t$ (13)
3.3.3. Proof of the effect of appraisal price

Based on Table 2 and according to the assumption of (5), $SIG1$ is EoA (Effect of Appraisal Price in Auction Sale Rate). The court appraisal time is in the past rather than the Auctioned time (1). The difference between the two points makes it difficult to define the court appraiser effect variable in terms of time series analysis. Since correcting the price difference that occurred in time for all auction cases is a very difficult challenge, the Fourier transform (4.3.2.1) is used. In this paper. Proving that $SIG1$ is EoA, 2,762 individual auction cases occurred between 2016.04 and 2018.03 in Seoul and Busan are empirically analyzed (Table 3, Table 4.)

Figure 5. The difference of time between Court Appraisal time and Auctioned time

The analysis is conducted in two main aspects:

  1. Time interval between the time of court appraisal and the time of Auctioned (Table 4)
  2. Regression with the general market price at the time of court appraisal price (Table 4)
    \begin{equation} \label{eq:cp}
    CP_t=\ \alpha_0dummy_t+\alpha_1MP_t+\gamma_t
    \end{equation}

where $CP_t$ is price at time of court appraisal (Figure 5), MP is housing price, $\alpha_0$ is dummy variable $\alpha_1$is parameter of housing price.

Table 3 Data Description
Table 4 Result of analysis
Figure 6. Residual Distribution in (15) & The difference between Court Appraisal and Auctioned time (days)

As shown in Table 4, the time difference distribution has a right skewed shape and the range of 25% to 75% is about 7 to 11 months. Price difference has a long-tailed distribution, and it can be estimated that the court appraisal price and the housing price at the time of the court appraisal have a very high correlation and are almost the same value. To summarize the results of the two analyses, the court appraisal price is the lag variable of the housing price. In terms of the component (5) EoA can be assumed to have a lag relationship with $Mkt$ and the results are shown in Table 5.

Table 5. Regression of analysis ($SIG1$ vs $Mkt$)

Table 5 [1] shows the relationship between the lag variable of $SIG1$ and $Mkt$. $SIG1$ extracted by Fourier transform is compared with lag variable and $Mkt$ of $SIG1$ because it is a signal indicating the past influence of the present time rather than the past price itself. In addition, the order of the Lag of the comparison target is set from 7 months to 11 months, which ranges from 25% to 75% of Table 4 As a result of the analysis, it was confirmed that the lag variable of $SIG1$ has a significant relationship with $Mkt$.

Table 5 [2] is a confirmation of whether $Mkt$'s lag variable can replace the court appraiser if the court appraisal price has a time lag relationship with the $Mkt$ according to the results of Table 4 As a result of the analysis, there is a significant relationship.

Table 5 [3] confirms the relationship between $SIG1$ and Auction sale rate. If the court appraiser can be replaced by $Mkt$'s lag variable only, as in Table 5, the $SIG1$ variable is not meaningful, but the results of the analysis show that Table 5 [3] is superior to Table [2]. The reason for this is that, as in Figure 6, there is no special depreciation factor in each auction case, which can be explained by $Mkt$'s lag, but there is an unidentified area that has a large gap with $Mkt$, such as legal issues, equity auctions, or the time difference does not fall between 25% and 75%.

Figure 7 Lag of $Mkt$ can be only represented to part of identified

To sum up with Result of Table 5, in Table 4 $Mkt$ and $SIG1$ have lag relations with $Mkt$ and are superior to the lag variables of $Mkt$ according to the limits of Figure 7. therefore, $SIG1$ can be presumed in terms of EoA, as assumed in (5).

3.3.4. Proof of the effect of premium price

Based on result of Table 2 and according to the assumption of (5), $SIG2$ is EoP (Effect of Price Premium in Auction Sale Rate). For the analysis, $SIG2$ is transformed to categorical value through sigmoid function to assume Price premium on/off as in 4.3.2.2. In this paper, two aspects support that $SIG2$ is an EoP.

  1. Verify that $\widehat{SIG2}$ can distinguish between discount and surcharge points. (Figure 8)
  2. Track what variables $SIG2$ is, name it, and verify it makes sense.
3.3.4.1. Distinguish to price premium pffect in auction sale rate

The $\widehat{SIG2}$ parameter of Table 2 [3] is about 0.49 with a positive sign Figure 8 is based on the baseline predicted by Table 2 [2], and the auction sale rate points are clearly distinguished up and down by $\widehat{SIG2}$ 1/0 of Table [3]. The righthand side of Figure 8 shows a distribution of different means and variances. Therefore, $SIG2$ can be presumed in terms of EoP, as assumed in (5).

Figure 8. Surcharge and discount points that can be distinguished by $\widehat{SIG2}$
3.3.4.2. Momentum factor

In 4.3.4.1, it is confirmed that $SIG2$ is a component that can explain the price premium effect, but it is meaningless if it cannot be explained by any variable in practice. In this paper, $SIG2$ confirms which variables can be compared, verifies whether it makes sense, and finally names it. First, $SIG2$ is likely to be a variable of the auction market itself because it is likely that EoM and EoP already has the effects of macro in almost. In fact, no significant correlation was found between comparable macroeconomic variables. According to the Lev result of Table 1, the future volatility of the auction market has a positive correlation with the auction sale rate, The EoP component also has a positive correlation according to table 2 [3]. So, the variable that can be compared as a component of the auction market itself is volatility (16)(17). The results of the verification of this hypothesis is shown in Table 6.

\begin{equation} \label{eq:signal-2-2}
SIG2_t=\ c_0+c_1{v1}_t+c_2{v2}_t+\eta_t, \ {v1}_t = \left(y_t-y_{t-1}\right)_t , \ {v2}_t=\ \left(y_{t-1}-y_{t-2}\right)_t
\end{equation}

\begin{equation} \label{eq:signal-2-3}
SIG2_t=\ c_0+c_1\left(y_t-y_{t-1}\right)t+c_2\left(y{t-1}-y_{t-2}\right)_t+\eta_t
\end{equation}

where c_0 is intercept, y is auction sale rate, v is volatility as differencing of auction sale rate.

Table 6. Regression result
Figure 9. Compare to between $SIG2$ vs $\widehat{C_t^T} V_{t}$ (16)
Figure 10. Surcharge and discount points that can be distinguished by $\sigma(\widehat{C^T} V_t)$

In Table 6, the volatility variable is significantly related to $SIG2$, and in Table 6, the value described by
the volatility variable (16)(17) and $SIG2$ show similar movements. Figure 10 shows that the volatility variable can distinguish between the surcharge and discount points well and has different distribution like Figure 8.

In summary, the volatility variable of Auction sale rate can be explained as the main factor that creates the Price premium effect, and in particular, the reason why volatility causes the price premium effect can be interpreted as the reason that the volatility of the auction market has a positive correlation with the Auction sale rate. As a result, the volatility component can be named the momentum of the auction market.

3.3.5. Time varying beta to capture price premium section

In 4.3.4, it was confirmed that $SIG2$ extracted through Fourier transform is a price premium effect and verified that it is a momentum factor. However, the analysis period of this paper is about 10 years, and it would be more reasonable to assume time-varying than parameter between the market and the Price Premium variable has a fixed constant. It means that the $\beta s$ (18) is not stable over time. Sensitivity of beta can be used to capture the section where momentum works in the market, beyond simply distinguishing the effect of price premium. In this paper, a Kalman filter is used to estimate the time-varying beta and Kalman filter is used to estimate the time-varying parameter.

\begin{equation} \label{eq:betas-not-stable}
{y_t=\beta_0}_\ {+\beta}_1Mkt_t+\beta_2SIG1_t+\ \beta_3\ {\widehat{SIG2}}_t+\epsilon_t , \epsilon_t~N(0,\sigma^2)
\end{equation}

3.3.5.1. Kalman filter

The Kalman filter is a model for describing dynamics based on measurements and recursive procedure for computing the estimator of the unobserved component or the state vector at time t.

\begin{equation} \label{eq:state-model}
\xi_t=F_t\xi_{t-1}+q_t , q_t~N(0,Q_\ ) \ \text{<State Model>}
\end{equation}

\begin{equation} \label{eq:observation-model}
y_t=H_t\xi_t+r_t , r_t~N(0,R_\ ) \ \text{<Observation Model>}
\end{equation}

Table 7. Description

<Predict Step>

Calculate the optimal parameter of $\xi_{t|t-1}$, based on available information up to time $t-1$,

\begin{equation} \label{eq:xi-hat}
{\hat{\xi}}{t|t-1}=F_t{\hat{\xi}}{t-1|t-1}
\end{equation}

\begin{equation} \label{eq:covariance-xi}
P_t=F_tP_{t-1}F_t^T+Q_\
\end{equation}

\begin{equation} \label{eq:state-matrix}
F_t=H_tP_{t-1}H_t^T+R
\end{equation}

Calculate the optimal parameter of $\xi_{t|t}$, based on available information up to time $t$,

\begin{equation} \label{eq:kalman-gain}
K_t=P_{t|t-1}H^T{F_{t|t-1}^T}^{-1}
\end{equation}

\begin{equation} \label{eq:covariance-at-time-t}
P_{t|t}=\left(1-K_tH_t\right)P_{t|t-1}
\end{equation}

\begin{equation} \label{eq:xi-at-time-t}
{\hat{\xi}}{t|t}={\hat{\xi}}{t|t-1}-K_t\ r_{t|t-1}\
\end{equation}

The random walk effect is considered by assuming that Q, R is the initial value near 0 (= diffuse prior) and F is the diag (1,1,1,1) unit matrix and the Kalman gain (K) determines the weight for the new information using the information of the error between the prediction and the observation.

Table 8 Compare to Kalman FIlter
Figure 11. Beta (OLS) vs Beta (Kalman Filter) & Beta ($Mkt$) vs Beta ($\widehat{SIG2}$)
Figure 12. The Sensitivity points of EoP to the Auction Market

Table 8 shows that Time varying betas with Kalman filter performs better than the OLS with stable parameters. Figure 11 compares the change of the parameters of $\widehat{SIG2}$ and the change of the parameters of $Mkt$ at the same time. In Figure 12, if the parameter of $\widehat{SIG2}$ exceeds the upper confidence interval of OLS, it is set to 1 and plotted. In Figure 11, the area where $\widehat{SIG2}$ exceeds the beta of $Mkt$ and the area 1 of Figure 12 are the same, indicating that the price premium effect of the
auction market is more sensitive than the market price effect. This can be assumed to be an momentum interval, and the price premium effect is a sensitive interval.

3.3.5.2. Experiment

It is necessary to confirm whether the logic constructed so far works in the auction market in the region other than the whole country. Furthermore, when the model is performed by region, the characteristics of each region can be confirmed. The target areas of the empirical analysis are Seoul and gyeong-gi area where the auction market is most active.

Table 9. Result of Seoul and Gyeong-gi
Figure 13. (Seoul) $Mkt$ vs Auction Sale rate in seoul (left) Distinguished auction sale rate by EoP (Right)
Figure 14. (Seoul) Beta (OLS) vs Beta (Kalman Filter) & Beta ($Mkt$) vs Beta ($\widehat{SIG2}$)
Figure 15. (Seoul) The Sensitivity points of EoP to the Seoul Auction Market
Figure 16. (Gyeong-gi) $Mkt$ vs Auction Sale rate (Left) Distinguished auction sale rate by EoP (Right)
Figure 17. (Gyeong-gi) Beta (OLS) vs Beta (Kalman Filter) & Beta ($Mkt$) vs Beta ($\widehat{SIG2}$)
Figure 18. (Gyeong-gi) The Sensitivity points of EoP to the Seoul Auction Market

Table 8 and Figure 13 to Figure 18 are the results of the analysis of Seoul and Gyeonggi Province. Table 8 [2] Beta of $SIG2$ shows that Seoul is a more sensitive area than Gyeonggi-do in terms of price premium, and Figure 13-15 shows these resultswell. In particular, Seoul's Beta of EoP has far exceeded $Mkt$'s Beta since early 2020, supporting the general perception that overheating sentiment is forming in the Seoul area in the apartment auction market. On the contrary, the effect of EoP is relatively low in Gyeonggi-do. In addition, through the above results, it can be distinguished whether the outlier points existing in the auction sale rate of each region are the influence of EoP.

4. Conclusion

The previous auction market studies using bottom-up method mainly analyzed the variables affecting the Auction sale rate or had the disadvantage that the space and time were limited to the data they had. In this paper, time series analysis was carried out from the market perspective, and the top-down method using Fourier transform was attempted to solve the problem that the court appraiser price could not reflect the general market price at the time of the auction, and the price premium effect could be specified through the proof of each component.

In addition, it was found that the reason for making the price premium effect in the auction market is the momentum effect, and the time varying beta (Kalman filter) supports the above logic showing that the price premium effect can be divided by region. It is practically impossible to analyze a vast amount of auction cases for the analysis of the auction market, and this paper was very encouraging in that it provided many participants in the auction market with indicators that can be viewed from a market perspective.

However, it requires a deep understanding of the momentum factor. The sensitive activity of the momentum factor signifies not just market rises or falls, it indicates shifts in the price relationship between the auction and the general markets. Intuitively, when the real estate market heats up, high demand narrows the gap between general market prices and auction prices.

Therefore, the role of the momentum factor can be interpreted as representing the 'popularity' of the auction market compared to the general market. To elaborate further, it can serve as an indicator to judge whether the market is overheating or cooling down in comparison to the general market.

The additional insights of this study are as follows: Korea's apartment auction market has only momentum factors except for market prices under court appraiser control. Macro factors such as government regulations and interest rates are in the market price, so the third variable of the auction market is only the momentum factor, which can be very important information for many participants in the auction market.

This paper can be more rigorous if the following limitations are resolved. Since the monthly auction sale rate data may not be enough to support the rigor of the analysis, a wider analysis period or more time will further support the rigor of the analysis. In addition, the rigor of the analysis will be supported if more data on the unidentified area can be obtained in the process of proving the appraiser component of the court.

References

[1] Arslan, Y., Guler, B. & Taskin, T(2015), “Joint dynamic of house prices and foreclosures,”

[2] Journal of Money, Credit and Banking, 47(1), 133-169.

[3] Clauretie, T.M., Daneshvary, N.,(2009). “Estimating the house foreclosure discount corrected for spatial price interdependence and endogeneity of marketing time,” Real Estate Economics. 37 (1), 43-67.

[4] Campbell, J.Y., Giglio, S., Pathak, P.,(2011). “Forced sales and house prices,” American Economic Review. 101 (5), 2108-2131.

[5] Forgey, F.A., Rutherford, R.C., VanBuskirk, M.L.,(1994). “Effect of foreclosure status on residential selling price,” Journal of Real Estate Research. 9 (3), 313-318.

[6] Jin, (2010). Is the Selling Price Discounted at the Real Estate Auction Market? Housing Studies Review, 18(3), 93-117.

[7] Lee, (2009). True Auction Price Ratio for Condominium: The Case of Gangnam Area, Seoul, Korea. Housing Studies Review, 17(4), 233-258.

[8] Lee, (2012). Anomalies in Real Estate Markets: A Survey. Housing Studies Review, 20(3), 5-40.

[9] Mergner, S. (2009). Applications of State Space Models in Finance (pp. 17-40). Universitätsverlag Göttingen.

[10] Oh, (2021). A study on influencing factors for auction successful bid price rate of apartments in Seoul area Journal of the Korea Real Estate Management Review, 23, 99-119.

[11] Shilling, J.D., Benjamin, J.D., Sirmans, C.F.,(1990). “Estimating net realizable value for distressed real estate,” Journal of Real Estate Research. 5 (1), 129-140.

[12] Springer, T.M.,(1996). “Single-family housing transactions: seller motivations, price, and marketing time,” Journal of Real Estate Finance Economics. 13 (3), 237-254.

[13] Wooldridge, J. M. (2015). Introductory econometrics: A modern approach (pp. 83-91). Cengage Learning.

[14] Zhou, H., Yuan, Y., Lako, C., Sklarz, M., McKinney, C.,(2015). “Foreclosure discount: definition and dynamic patterns,” Real Estate Economics. 43 (3), 683-718.

[15] Zhou, Y., Cao, W., Liu, L., Agaian, S., & Chen, C. P. (2015). Fast Fourier transform using matrix decomposition. Information Sciences, 291, 172-183.

MDSA, 2023 1st seminar

MDSA, 2023 1st seminar

Member for

6 months 1 week
Real name
GIAI News

The first seminar of the Data Science Management Association was held at Forest Hall on May 12, 2023 / Photo = Data Science Management Association

The Data Science Management Association successfully held the ‘Data Science Management Association 2023 1st Seminar’ on the 12th at Yeoksam Forest Hall under the theme of ‘Corporate Management Activities of AI Algorithms’.

The seminar was conducted in the following order: topic presentation, Q&A, and general discussion. Starting with the topic presentation by President Ho-yong Choi, topic presentations were made in that order by Academician Jeong-hoon Song, Hye-young Park, Bo-hyun Yoo, Min-cheol Kim, Jeong-woo Park, and finally Gyeong-hwan Lee, CEO of Pabii.

First, President Hoyong Choi gave a presentation on ‘Deep Learning as Solution Methods in Finance’ and introduced how machine learning and deep learning techniques can be used to find solutions to partial differential equations related to cash asset dividends of big tech companies. .

Academic member Song Jeong-hoon pointed out the problems with existing electricity/gas usage forecasts under the theme of ‘Monthly electricity/gas usage forecast for each building’ and further predicted monthly energy usage through statistical techniques that calculate the off-diagonal component of the second moment matrix. A model that predicts more accurately was introduced.

In order to find bubbles in the real estate sales market or auction market under the topic ‘Is bubble in housing auction market really bubble?’, academy member Park Hye-young defined the ‘difference between first and second place in the auction market’ as ‘bubble index’ and used it as a statistical index. The verification process through testing was explained.

Academician Bo-Hyun Yoo introduced a paper on the topic of ‘Discount/surcharge and momentum in the real estate auction market’ in which the factors that make up the winning bid rate in the real estate auction market were extracted using Fourier transform and the results were statistically verified.

Under the theme of ‘Interpretable Topic Analysis,’ academic member Mincheol Kim discussed a true ‘big data’ service that can be of practical help in matching between overseas buyers and domestic companies.

Under the theme of ‘Advertising time series modeling under measurement error,’ Jeongwoo Park, a member of the Academy of Sciences, introduced an advertising performance prediction model that statistically verifies and corrects the impact of measurement error included in user data of digital advertising.

Lastly, Professor Keith Lee discussed the interpretation and application cases of the recently controversial mathematical model related to ChatGPT, as well as expected usage methods, under the topic of ‘Use and Limitations of ChatGPT’.

In the general discussion that followed, SIAI (Swiss Institute Artificial Intelligence) students and MDSA academic members had a heated discussion about the direction of innovation and development in the Korean data science industry.

Member for

6 months 1 week
Real name
GIAI News

MDSA Korean aI/DS news journal publication as of apr 2023

MDSA Korean aI/DS news journal publication as of apr 2023

Member for

6 months 1 week
Real name
GIAI News

The Managerial Data Science Association (MDSA) has been operating an online magazine since April 1,2023.

SIAI Professor Kyung-hwan Lee, one of the founders of the society, donated the Internet media company registered with Seoul City Hall to MDSA in October 2020, and MDSA will operate it as of April 1, 2023.

Subsequently, MDSA was incorporated under the Global Institute of Artificial Intelligence (GIAI), and the name of the journal was confirmed as GIAI R&D Korea, which refers to GIAI’s Korean research institute. GIAI is a group of global researchers and already has its own research institute in Europe. The research institute is already operating more specialized academic paper sharing and expert contributions than GIAI R&D Korea under the name of GIAI R&D. GIAI R&D Korea will also share Korean translations of some of the content operated by GIAI R&D.

In order to ensure the independence of the editorial journal’s opinion, ownership has been transferred to an independent corporation under MDSA, but the election of the editor-in-chief and verification of AI/data science knowledge are operated under the supervision of the MDSA board of directors. SIAI Professor Gyeong-Hwan Lee, who is in charge of MDSA’s audit, said that he referenced the structure of Newstapa, which has a reputation for investigative reporting in Korea, which operates an independent professional journal under the supervision of a non-profit corporation.

Member for

6 months 1 week
Real name
GIAI News

MDSA 2023 Brunch seminar

MDSA 2023 Brunch seminar

Member for

6 months 1 week
Real name
GIAI News

On Mar 18, the Managerial Data Science Association (MDSA) held a small seminar to commemorate the establishment of the corporation.

Next, we plan to hold a second small seminar in April and then confirm the presenters for the society’s official seminar in May.

In the discussion on this day, the May conference seminar was decided to be held on May 12.

Member for

6 months 1 week
Real name
GIAI News

MDSA Offical foundation

MDSA Offical foundation

Member for

6 months 1 week
Real name
GIAI News

The Managerial Data Science Association (MDSA), chaired by KAIST technology management professor Ho-yong Choi, announced on February 9 that it had received permission to establish an incorporated association from Seoul City Hall. Subsequently, the corporation was established on March 9th.

KAIST technology management professor Choi Ho-yong, president of the society, as well as Kookmin University College of Economics professor Kim Jae-jun and Korea University technology management professor Kim Jong-myeon were appointed as directors. In addition, Professor Kyunghwan Lee of the Swiss Institute of Artificial Intelligence (SIAI), director of the Global Institute of Artificial Intelligence (GIAI) research institute, will serve as auditor.

With the private contribution of SIAI Professor Gyeong-hwan Lee, MDSA will operate a specialized journal under the academic society from April 1st. The first seminar after the establishment of the corporation is scheduled to be held in May.

Member for

6 months 1 week
Real name
GIAI News

Data Science Management Association (MDSA) 2023 inaugural general meeting

Data Science Management Association (MDSA) 2023 inaugural general meeting

Member for

6 months 1 week
Real name
GIAI News

The Data Science Management Association (MDSA) announced on the 7th that it held its 2023 inaugural general meeting.

The society, which has been in the process of obtaining approval as a non-profit corporation since April of last year, will conclude its activities in 2022 and will proceed with the operation of a professional journal, seminars, and AI/data science education activities under the society in accordance with the time of corporate approval this year.

Member for

6 months 1 week
Real name
GIAI News

Data Science Management Society 2022 2nd Establishment General Meeting

Data Science Management Society 2022 2nd Establishment General Meeting

Member for

6 months 1 week
Real name
GIAI News

The Managerial Data Science Association (MDSA) held its founding general meeting on Saturday, August 27, 2022.

KAIST technology management professor Choi Ho-yong, president of the society, as well as Kookmin University College of Economics professor Kim Jae-jun and Korea University technology management professor Kim Jong-myeon were appointed as directors. In addition, Professor Kyunghwan Lee of the Swiss Institute of Artificial Intelligence (SIAI), director of the Global Institute of Artificial Intelligence (GIAI) research institute, will serve as auditor.

Four professors announced that they established the society through MDSA for the purpose of supporting the application of data science to corporate management. In particular, the main purpose of establishing the society is to conduct specialized journals, academic seminars, and basic education to improve Korea’s AI reality, which focuses on simple computer programming.

The society initially held the founding general meeting in April, but announced that it held the second founding general meeting in accordance with the demands of Seoul City Hall, the licensing agency. The society is about to receive approval for establishment as a non-profit corporation from the Ministry of Trade, Industry and Energy through Seoul City Hall.

Member for

6 months 1 week
Real name
GIAI News

Data Science Management Society 2022 1st Establishment General Meeting

Data Science Management Society 2022 1st Establishment General Meeting

Member for

6 months 1 week
Real name
GIAI News

The Managerial Data Science Association (MDSA) held its founding general meeting on Saturday, April 30, 2022.

KAIST technology management professor Choi Ho-yong, president of the society, as well as Kookmin University College of Economics professor Kim Jae-jun and Korea University technology management professor Kim Jong-myeon were appointed as directors. In addition, Professor Kyunghwan Lee of the Swiss Institute of Artificial Intelligence (SIAI), director of the Global Institute of Artificial Intelligence (GIAI) research institute, will serve as auditor.

Four professors announced that they established the society through MDSA for the purpose of supporting the application of data science to corporate management. In particular, the main purpose of establishing the society is to conduct specialized journals, academic seminars, and basic education to improve Korea’s AI reality, which focuses on simple computer programming.

The society is currently awaiting approval to establish a non-profit corporation from the Ministry of Trade, Industry and Energy through Seoul City Hall.

Member for

6 months 1 week
Real name
GIAI News